George Osborne has failed the very tests he set himself in 2010 – and we are poorer as a result
GDP per capita is lower than it was when the Coalition was formed

Sign up for the View from Westminster email for expert analysis straight to your inbox
Get our free View from Westminster email
At a meeting I had with George Osborne in his office in the House of Commons just before the Coalition was formed in May 2010, I told him that the recession he was inevitably going to create would eventually be his to own. That is to say he could for only so long blame Labour because chickens eventually come home to roost.
I also told him that the British people would eventually “eat the data”. By that I meant that no matter how much politicians try to spin and pretend all is well, the people will feel what is going on in their daily lives. A Chancellor can claim he is vindicated, but those are empty words if the evidence outside the Palace of Westminster bubble is to the contrary.
Most people are still hurting and don’t seem to believe the Tory claims that all is well. Plus it is hard to argue that the fix to a boom and housing bust is another boom and housing bust that even Mr Osborne’s pet flunky, Bank of England Governor Mark Carney, is now getting worried about.
The first piece of evidence I bring to bear is from an Ipsos-Mori poll taken after the Autumn Statement.
When asked if the Autumn Statement was good for people, 51 per cent said “bad”, 21 per cent said “good”, with 27 per cent don’t know.
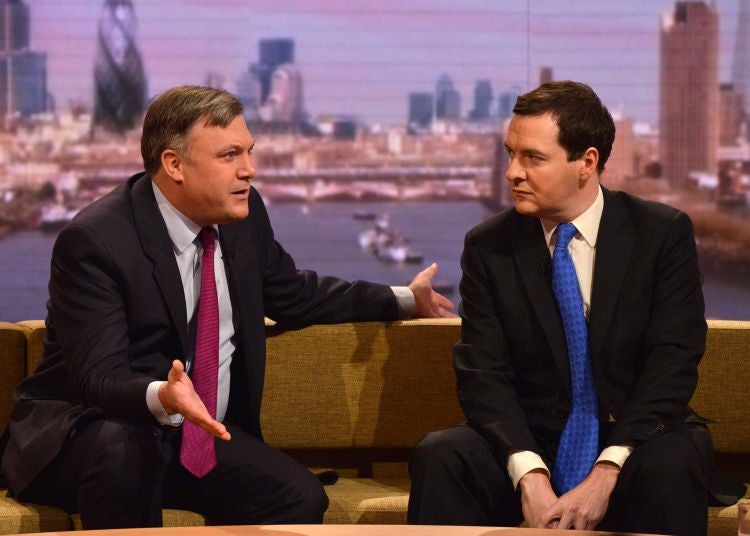
But the biggest shocker for Mr Osborne was this question: “Which of the following do you agree with most?” Ed Balls, who says George Osborne is in denial about the cost of living crisis (40 per cent). George Osborne, who says his long-term plan for economic recovery is working (24 per cent). “Neither” got 27 per cent and 10 per cent didn’t know.
The second piece of evidence that suggests Mr Osborne has been a disastrous failure is the evidence on what has happened to GDP per head since he took office.

GDP is a measure of wellbeing and hence is best expressed per head of population. This is especially important as the size of the 16-plus population is up 2.5 per cent, or one and a quarter million, since May 2010.
The chart, which uses Office for National Statistics data, plots quarterly GDP per head and shows that it is lower in the second quarter of 2013 than it was in the same three months in 2010, so people are worse off today than they were when the Coalition took office in May 2010.
Even though the latest annual survey of hours and earnings survey data through April 2013 suggest full-time, median earnings have risen 2.2 per cent compared with April 2012, the more recent Office for National Statistics data from the labour force survey shows that even though there has been an increase in mean nominal wages over the past year, median nominal weekly and hourly wages for the typical employee have fallen in the past 12 months.
For example, median hourly wages of full-timers fell from £11.63 an hour in July-September 2012 to £11.55 an hour in July-September 2013, while their weekly earnings fell from £471 to £462.
But the mean has risen; in weekly earnings from £558 to £563 and in hourly from £13.97 to £14.15.
This is because earners at the top pull up the mean but not the median. The middle is stuck. To get real wages up for the typical worker by the 2015 election is going to involve a monumental effort to say the least. In his Mais lecture given in February 2010, Mr Osborne claimed that “the economics profession is in broad agreement that the recovery will only be sustainable if it is accompanied by an internal and external rebalancing of our economy: in other words a higher savings rate, more business investment, and rising net exports”.
So it seems reasonable to test Mr Osborne on the criteria he set himself – for now we won’t mention keeping the AAA credit rating, or lowering youth unemployment, or the claim that “we are all in this together”.
Let’s look at each in turn – savings, trade and investment. Just to put this into context there was no mention of the word “rebalancing” in the 2013 Autumn Statement. Not one.
The savings rate, as a percentage of household disposable income according to the Organisation for Economic Co-operation and Development, has fallen, not risen, from the 7.3 per cent the coalition inherited in 2010 to 5.8 per cent in 2013.
The OECD forecasts it will fall even further to 4.4 per cent by 2015. In contrast, Germany has a savings rate of 9.9 per cent. And what is the evidence on the latest boost in consumption, where is that coming from? Dis-saving of course, fueled by Mr Osborne’s mad Help to Raise House Prices Scheme.
So on savings the rate has gone down, not up, so according to Mr Osborne’s own criteria that gets a fail grade on my Osbornomics 101 exam.
Now to net trade. The only thing Mr Osborne had to say about that in his Autumn Statement was “exports are too low”. The table on the left reports on the Office for Budget Responsibility’s forecast for growth in net trade, the balance between exports and imports.
A positive number means a positive contribution to growth. All that needs to be said is that in 2010 the OBR expected net trade to make a contribution to growth in every year from 2012 through to 2015.
But now it expects it to detract from growth. So another fail grade in the Osbornomics 101 exam.
Finally to investment, which in 2013 is also expected by the OBR to detract from growth and then to become a major contributor.
Why the transformation occurs remains unclear, especially given the OBR forecast it would be making a huge contribution in 2012 and 2013, but, in fact, has lowered growth. Another fail.
As Ed Balls, Labour’s Treasury spokesman, tells me: “when people ask at the time of the next election ‘am I better off today than when David Cameron and George Osborne came to office?’ the answer looks set to be No.
“That was the clear view of the Institute for Fiscal Studies after the Autumn Statement, which did nothing to tackle the cost-of-living crisis and ensure we can earn our way to higher living standards for all.”
Things may look good in Kensington and Chelsea but where ordinary people live nothing has changed. The emperor really does have no clothes.
Join our commenting forum
Join thought-provoking conversations, follow other Independent readers and see their replies